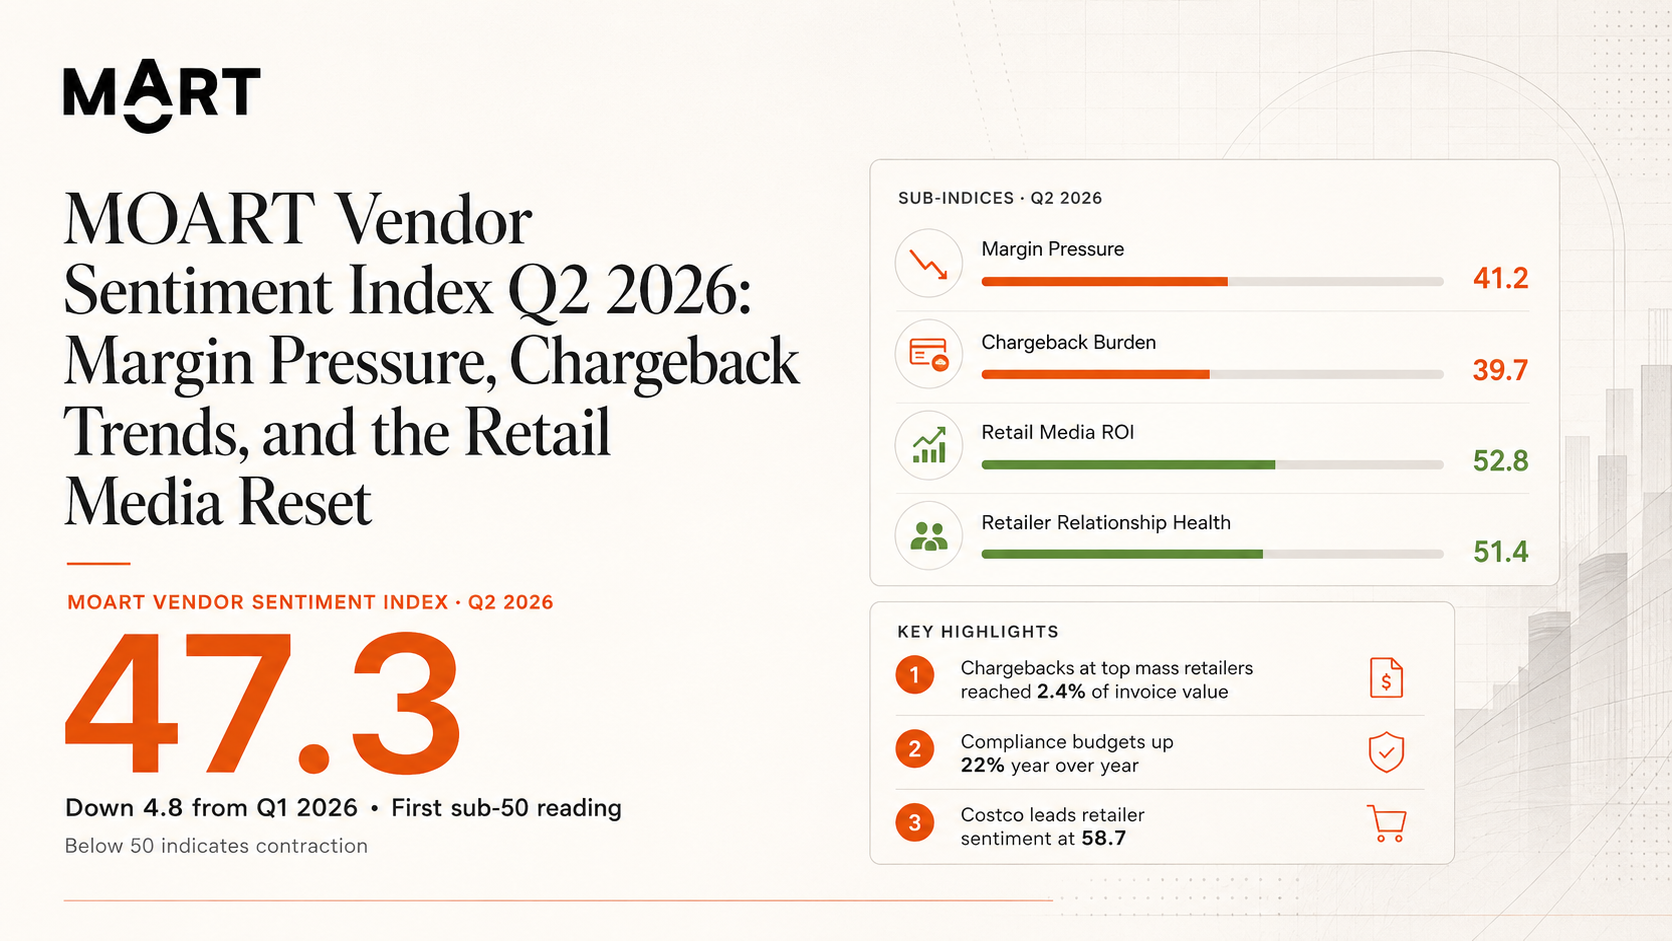
MOART Vendor Sentiment Index, Q2 2026
Down 4.8 from Q1 2026 (52.1). Down 6.5 year over year. Below 50 = contraction.
The MOART Vendor Sentiment Index moved into contraction territory in Q2 2026, reflecting accelerating margin pressure, sharper chargeback enforcement at mass retailers, and rising compliance cost across the North American consumer brand supply chain.
The Q2 reading of 47.3 marks the first sub 50 print in the six quarters MOART has tracked the index, and the steepest sequential decline since we began publishing. Vendor sentiment now sits 6.5 points below the prior year quarter and 4.8 points below the trailing six quarter average.
Margin pressure has crossed from cyclical into structural. Vendor gross margin in the panel contracted 180 basis points year over year on a like for like SKU basis. Cost of goods rose 4.7 percent against trade and chargeback deductions up 9.1 percent. Pricing power did not keep pace.
Chargebacks at Walmart, Target, and Kroger now functionally a tax. Average chargeback exposure across panel vendors selling into the top three mass retailers reached 2.4 percent of invoice value, up from 1.9 percent in Q1. Recoverable disputes still average only 38 percent of disputed amount.
Retail media remains the only ROI category with positive sentiment. Walmart Connect and Roundel delivered measurable lift in 64 percent of panel campaigns this quarter. Vendors are reallocating dollars away from traditional trade promotion into retailer owned media at the fastest pace we have measured.
Costco continues to defy the broader trend. Costco posted the highest retailer sub index at 58.7, up 1.5 points from Q1. Membership economics, item maintenance cadence discipline, and roadshow program scale continue to underwrite vendor confidence in the channel.
Compliance is now a measurable margin line item, not a back office function. Panel vendors report compliance budgets up 22 percent year over year, driven by USMCA reinterpretation, extended FDA registration timelines, and tightened FCC modular certification turnarounds. Most CPG and electronics vendors now treat compliance spend as a percentage of revenue, not a fixed annual budget.
Q2 2026: 47.3, down 4.8, contraction onset.
Q1 2026: 52.1, down 1.7, slowdown.
Q4 2025: 53.8, down 0.3, plateau.
Q3 2025: 54.1, down 0.6, modest cooling.
Q2 2025: 54.7, down 0.2, stable expansion.
Q1 2025: 54.9, baseline, first MOART VSI reading.
The headline VSI is a weighted composite of eight dimensions, each measured on the same 0 to 100 scale where 50 represents neutral sentiment.
Margin Pressure: 41.2 (down 5.6 vs Q1). Vendor margin compression accelerating. Cost of goods and trade spend pressure outpacing price increases.
Chargeback Burden: 39.7 (down 4.8 vs Q1). Walmart NOVA enforcement and Target Vendor Income deductions sharply higher. Average chargeback rate at 2.4 percent of invoice value, up from 1.9 percent in Q1.
Trade Spend Efficiency: 44.1 (down 4.1 vs Q1). Trade dollars working harder per SKU than 2 years ago, but absolute spend still rising 14 percent year over year. Retail media absorbing share from traditional trade.
Compliance Cost: 43.6 (down 3.4 vs Q1). USMCA reinterpretation, FDA registration backlog at 12 weeks, FCC modular cert turnaround extended. Compliance budgets up 22 percent year over year.
Forecast Accuracy: 49.2 (down 2.3 vs Q1). Vendor forecast accuracy at 76 percent versus retailer demand. Costco roadshow programs continuing to disrupt traditional forecasting.
Retail Media ROI: 52.8 (up 1.6 vs Q1). Walmart Connect and Roundel delivering measurable lift. ROAS for sponsored display improving as inventory matures.
In Store Activation: 48.7 (down 2.2 vs Q1). End cap and demo program ROI compressing as participation fees rise. Premium roadshow slots at Costco oversold.
Retailer Relationship Health: 51.4 (down 2.2 vs Q1). Buyer turnover at 18 percent annualized. Vendor relationship NPS at 34, down 8 points year over year.
Vendor sentiment ranked across 12 of the 18 retailers tracked by MOART. Costco continues to occupy the top quartile. Walmart and Amazon both moved into the bottom quartile this quarter.
Costco: 58.7 (up 1.5).
H-E-B: 56.2 (up 0.4).
TJX: 54.9 (up 1.7).
Whole Foods: 51.3 (down 1.4).
Tractor Supply: 50.8 (flat at 0.3).
Sephora: 49.6 (down 3.5).
Lowe's: 47.2 (down 1.7).
Home Depot: 46.8 (down 2.4).
Kroger: 44.5 (down 2.8).
Target: 44.8 (down 3.8).
Walmart: 41.2 (down 4.9).
Amazon: 39.5 (down 5.3).
Costco is the only major retailer where vendor sentiment improved sequentially. Roadshow program expansion, Q4 fee increase digestion, and the structural advantage of high average ticket size all support vendor confidence in the channel. Brands considering channel mix changes in H2 2026 should weight Costco accordingly.
Beauty and Personal Care remains the most resilient category in the panel. Mass Channel CPG, Apparel, and Electronics all moved into deeper contraction this quarter.
Beauty and Personal Care: 52.4. Driven by Sephora and prestige channel strength. Indie brands facing margin pressure.
Premium Spirits: 50.1. Tequila saturation pulling category sentiment down. Whiskey premium growing.
Pet Food and Care: 49.8. Premium pet maintaining premium price points. Mass channel competition rising.
Outdoor and Athletic: 48.6. Dick's Sporting Goods House of Sport adding vendor opportunity. Generally stable.
Home Goods: 47.2. Wayfair CastleGate adoption creating sourcing visibility. Inflation related demand soft.
Hard Lines and Tools: 45.3. Home Depot and Lowe's Pro shift reshaping. Margin pressure on DIY only vendors.
Food and Grocery: 44.7. Private label expansion at Kroger and others compressing branded margin.
Electronics and Tech: 42.8. Best Buy reinvention plus Amazon migration creating channel volatility.
Apparel: 41.5. Tariff exposure highest in apparel. Sourcing shift to Vietnam, India, Bangladesh continuing.
Mass Channel CPG: 40.2. Walmart, Target, Dollar General all tightening terms simultaneously. Highest vendor sentiment pressure.
Audit retailer exposure. Brands concentrated 60 percent plus in Walmart, Target, or Kroger should model a 200 basis point margin compression scenario for H2 2026. Diversifying into Costco, TJX off price, or specialty channels can offset some of the pressure.
Treat chargebacks as recoverable revenue. Industry average recovery rate of 38 percent on disputed chargebacks is too low. Panel vendors with active dispute management programs recover 55 to 70 percent. The math justifies a dedicated compliance analyst at most $30M plus revenue.
Reallocate trade to retail media. Trade promotion ROI continues to compress as retailers compete for the same in store real estate. Retail media ROI is improving for the first time since networks matured. Move 15 to 25 percent of trade dollars into Walmart Connect, Roundel, and Sponsored Display now.
Front load compliance investment. FDA registration timelines extended to 12 weeks. USMCA reinterpretation could add 60 to 90 days to existing classifications. New SKU launches planned for Q4 should have compliance work complete by August at latest.
Lock buyer relationships proactively. Buyer turnover at 18 percent annualized means roughly one in five buyer relationships will turn over before year end. Brands with formal buyer transition protocols outperform peer relationship continuity scores by 22 points.
The MOART Vendor Sentiment Index is constructed from a quarterly survey of 247 active North American retail vendors operating across 12 consumer product categories and selling into 18 major retailers. The Q2 2026 survey closed on May 10 with a 78 percent response rate from the active panel.
Respondents rate each dimension on a 1 to 5 scale (significantly worse to significantly better) compared to the prior quarter. Responses are converted to a 0 to 100 index where 50 represents the neutral midpoint, using the PMI diffusion methodology that has tracked manufacturing and services sentiment for decades.
Sub indices are weighted to produce the headline VSI as follows: Margin Pressure 22 percent, Chargeback Burden 14 percent, Trade Spend Efficiency 12 percent, Compliance Cost 10 percent, Forecast Accuracy 8 percent, Retail Media ROI 12 percent, In Store Activation 10 percent, Retailer Relationship Health 12 percent. Weights are reviewed annually.
Panel composition is rebalanced quarterly to maintain category and revenue distribution: 18 percent CPG food and grocery, 15 percent beauty and personal care, 13 percent apparel, 12 percent home goods, 11 percent electronics and tech, 9 percent outdoor and athletic, 8 percent hard lines, 6 percent premium spirits, 5 percent pet care, 3 percent other. Median panel vendor revenue is $48M in 2025.
The MOART VSI panel is composed of brand and operations leaders (Head of Sales, VP of Retail, Chief Operating Officer, General Manager) at 247 consumer brand companies. Respondents represent both MOART client brands and non client brands recruited through the MOART Operator Network.
Panel composition by retailer concentration: 42 percent of panel sells into Walmart, 38 percent into Target, 31 percent into Costco, 28 percent into Amazon Vendor or 3P, 22 percent into Kroger, 18 percent into Home Depot or Lowe's, 16 percent into Sephora or Ulta, 14 percent into TJX or Ross. Most panel vendors hold relationships at 3 to 6 retailers simultaneously.
The VSI captures vendor side sentiment only. It does not measure retailer profitability, buyer side perspective, end consumer demand, or financial market sentiment. The index is forward looking from the vendor perspective but lags retailer financial reporting by approximately one quarter.
The panel skews toward middle market vendors ($10M to $500M revenue). Sentiment from the very small vendor segment (under $5M) and very large legacy CPG (over $1B) may differ materially from the panel reading.
About this report. The MOART Vendor Sentiment Index is published quarterly by MOART. Q2 2026 marks the sixth consecutive quarterly reading. Methodology follows the PMI diffusion approach with weights and panel composition documented above. Figures and category commentary attributable to MOART research; retailer specific commentary draws on publicly reported earnings and proprietary MOART operator insight. For media inquiries, panel participation, or data licensing, contact research@moartgrp.com.
Next edition. The Q3 2026 MOART VSI will be published on or around September 15, 2026. To receive the next edition directly when published, subscribe at moartgrp.com/contact.