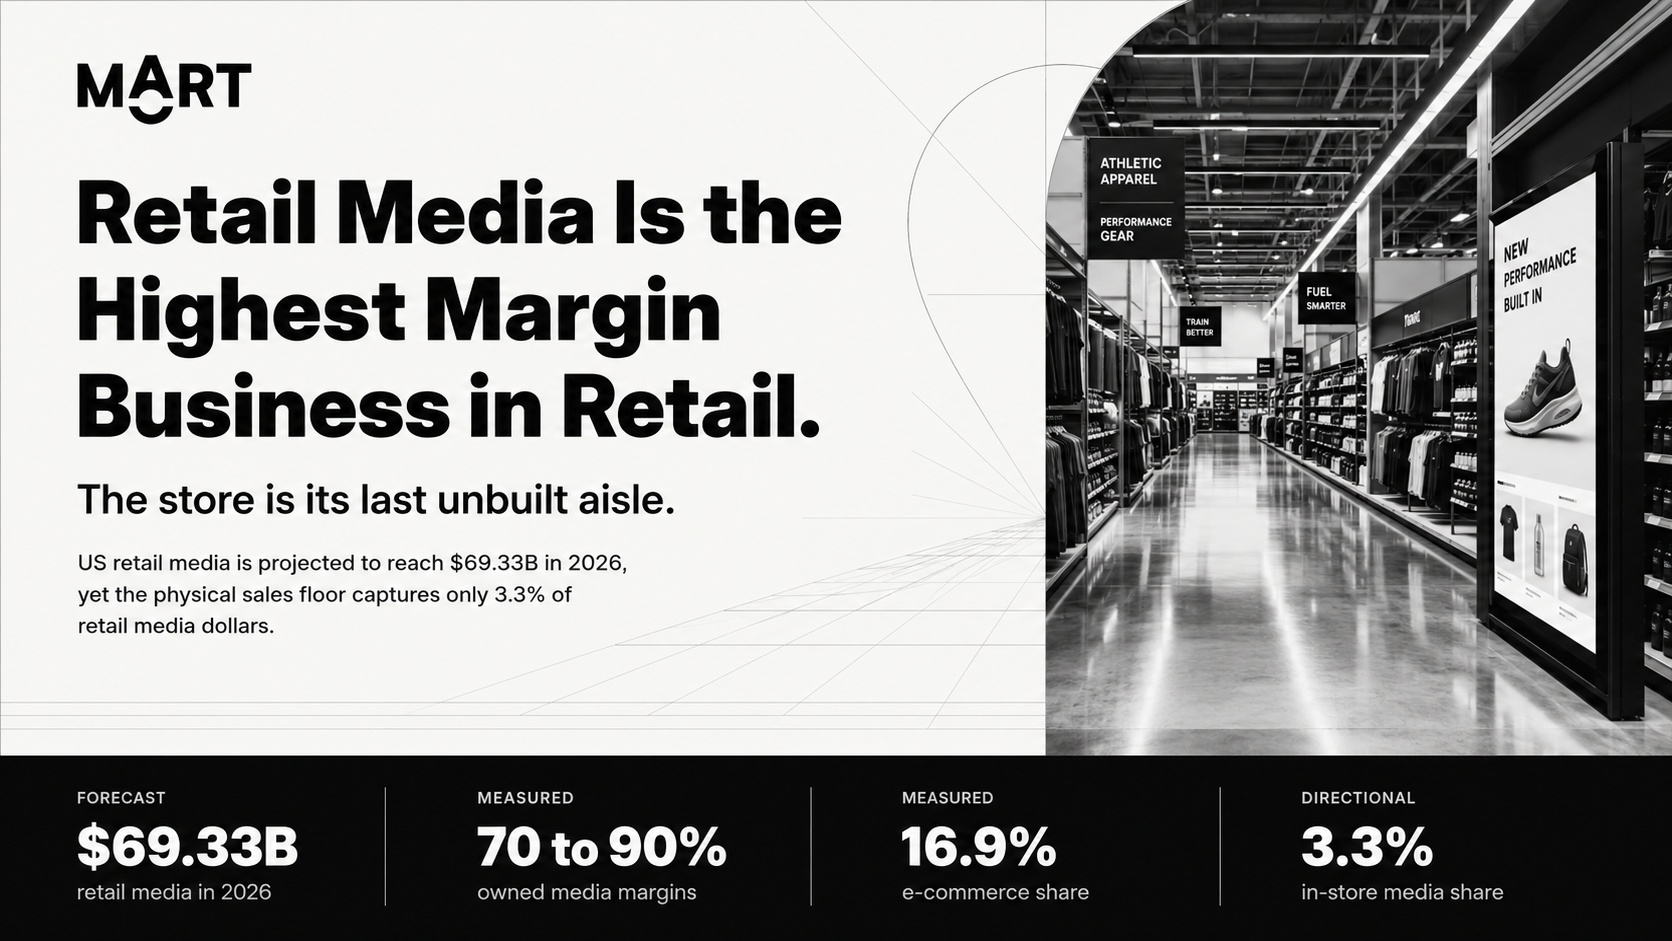
US retail media will clear $69 billion in 2026 at 70 to 90 percent margins. At Walmart, advertising and membership already drive roughly a third of operating profit. Yet the sales floor, where about 83 percent of buying still happens outside e-commerce, captures barely 3 percent of retail media dollars. The next retail profit pool will not be won on the homepage. It will be won on the floor.
The finance desk reads the 3.3 percent number as a warning. The operator reads it as the largest un-monetized, highest-margin asset in the building.
By the MOART Retail Operations Desk. Written from both sides of the buyer's desk, with five decades of combined operator experience across North American mass, grocery, drug, club, and specialty retail.
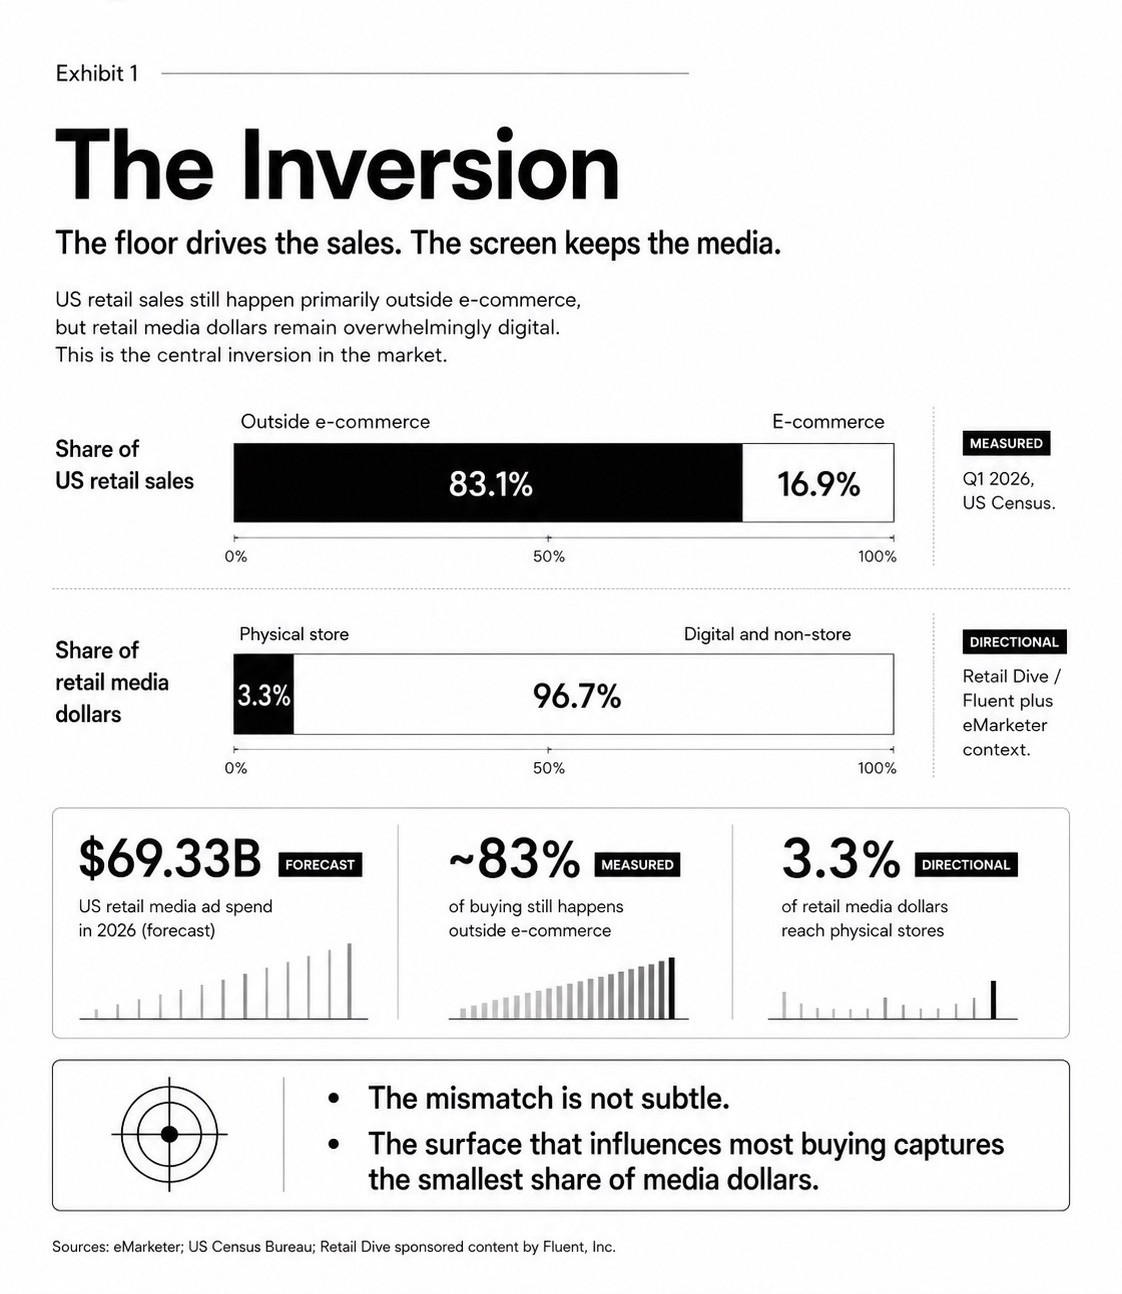
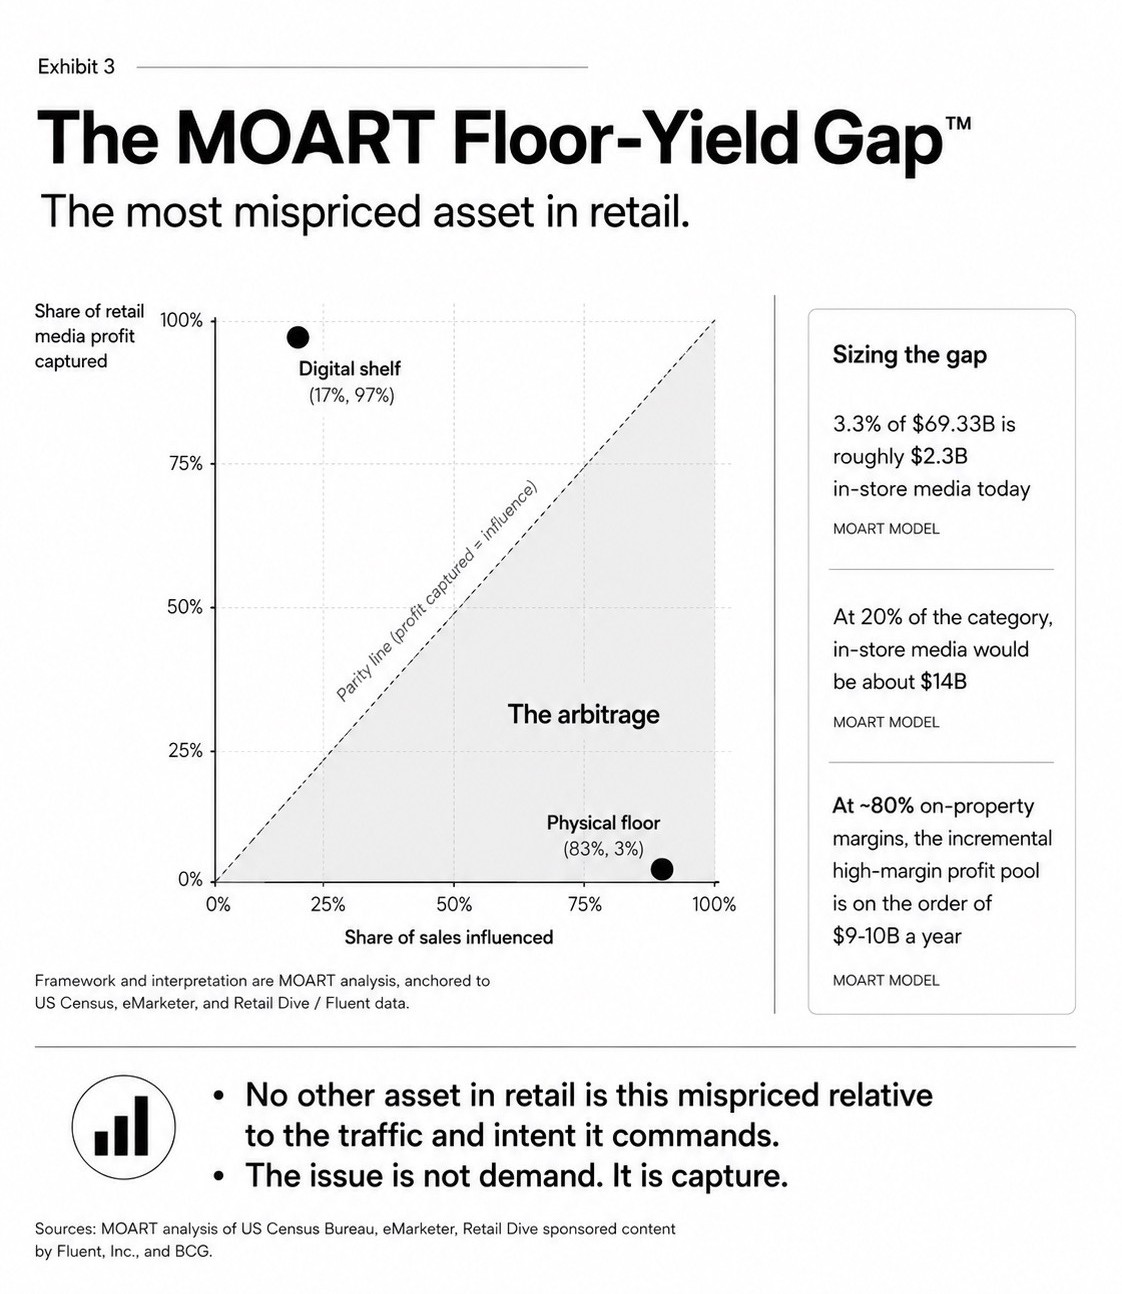
US retail sales still happen primarily outside e-commerce — 83.1 percent outside versus 16.9 percent e-commerce in Q1 2026 (US Census) — but retail media dollars remain overwhelmingly digital, at 96.7 percent digital and non-store versus just 3.3 percent physical store. This is the central inversion in the market: the surface that influences the most buying captures the smallest share of media dollars. The mismatch is not subtle.
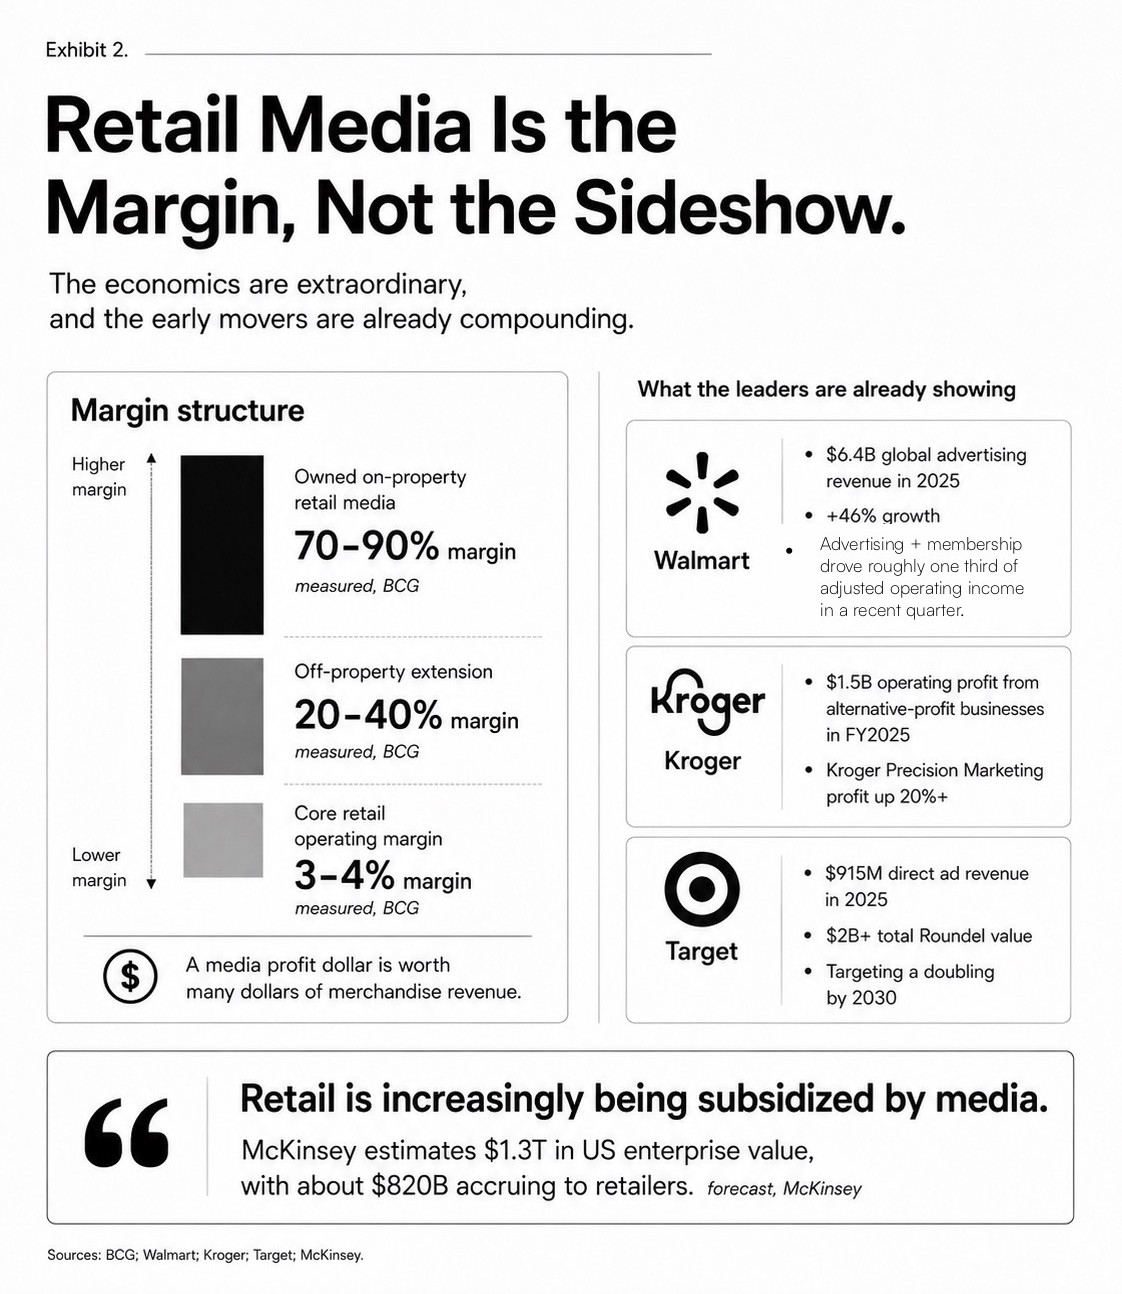
The economics are extraordinary, and the early movers are already compounding. Owned on-property retail media runs at a 70 to 90 percent margin and off-property extension at 20 to 40 percent, against a 3 to 4 percent core retail operating margin (measured, BCG). A media profit dollar is worth many dollars of merchandise revenue. Walmart posted $6.4B in global advertising revenue in 2025, up 46 percent, with advertising plus membership driving roughly one third of adjusted operating income in a recent quarter. Kroger reported $1.5B of operating profit from alternative-profit businesses in FY2025, with Kroger Precision Marketing profit up more than 20 percent. Target posted $915M in direct ad revenue in 2025, $2B+ in total Roundel value, and is targeting a doubling by 2030. McKinsey estimates $1.3T in US enterprise value from retail media, with about $820B accruing to retailers. Retail is increasingly being subsidized by media.
Plot the share of retail media profit captured against the share of sales influenced. The digital shelf sits at roughly 17 percent of sales but 97 percent of profit captured; the physical floor sits at about 83 percent of sales but only 3 percent captured. The area beneath the parity line is the arbitrage. Sizing the gap: 3.3 percent of $69.33B is roughly $2.3B of in-store media today; at 20 percent of the category, in-store media would be about $14B; and at around 80 percent on-property margins, the incremental high-margin profit pool is on the order of $9–10B a year (MOART model). No other asset in retail is this mispriced relative to the traffic and intent it commands. The issue is not demand. It is capture.
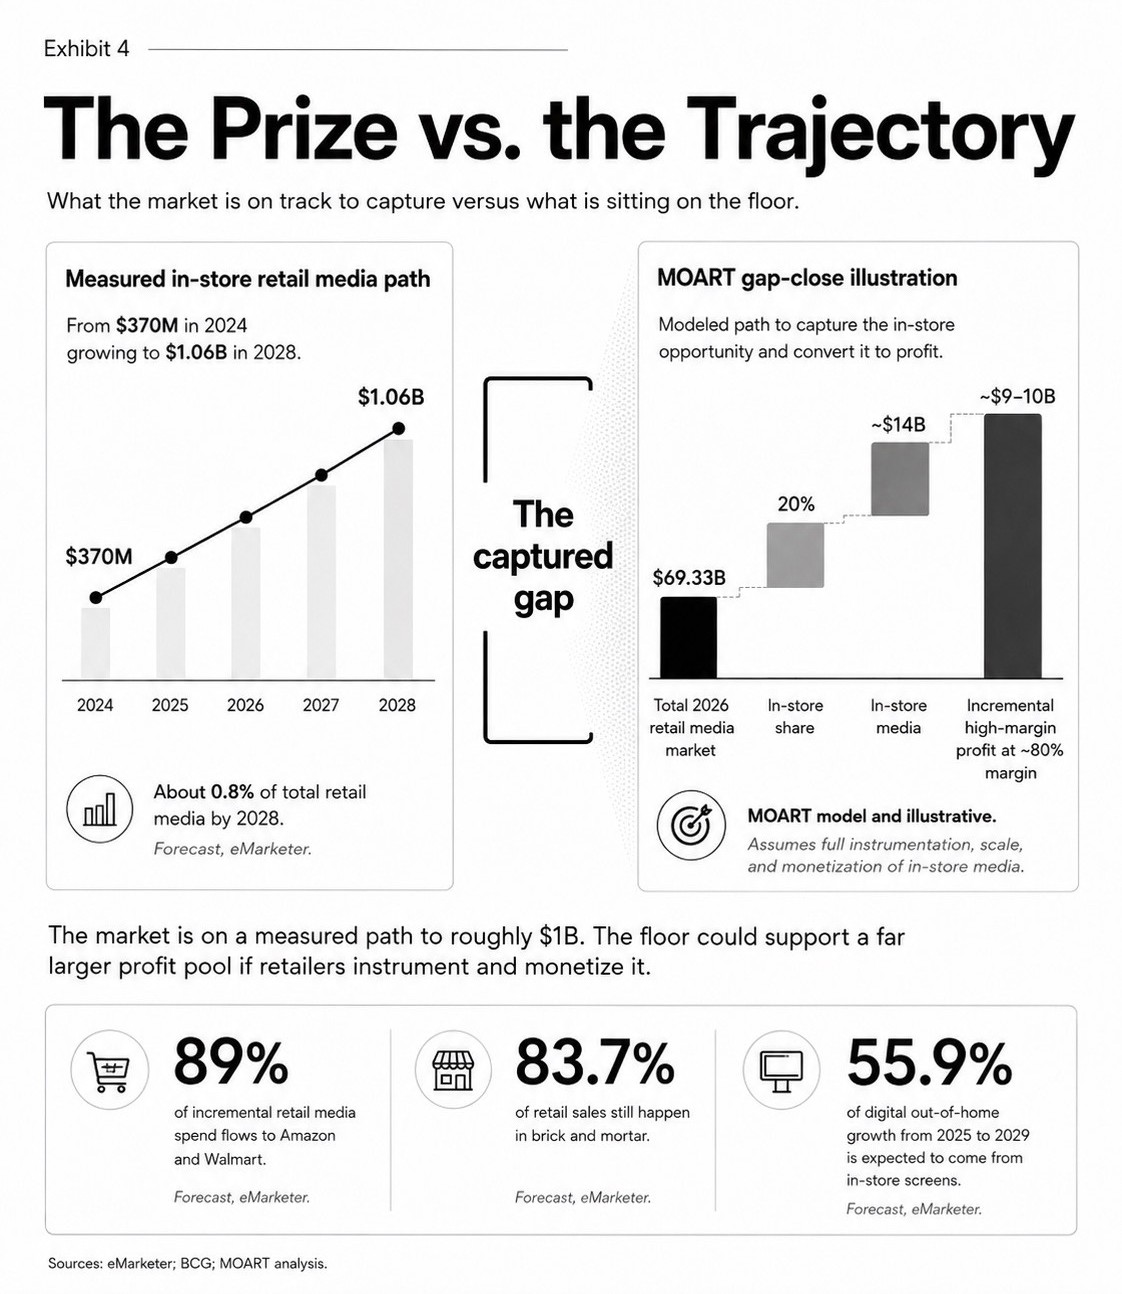
The measured in-store retail media path grows from $370M in 2024 to $1.06B in 2028 — about 0.8 percent of total retail media by 2028 (eMarketer forecast). The MOART gap-close illustration models capturing that in-store opportunity and converting it to profit: from a $69.33B total 2026 retail media market, a 20 percent in-store share implies about $14B of in-store media, and at roughly 80 percent margin an incremental high-margin profit on the order of $9–10B (MOART model and illustrative, assuming full instrumentation, scale, and monetization). The market is on a measured path to roughly $1B; the floor could support a far larger profit pool if retailers instrument and monetize it. For context, 89 percent of incremental retail media spend flows to Amazon and Walmart, 83.7 percent of retail sales still happen in brick and mortar, and 55.9 percent of digital out-of-home growth from 2025 to 2029 is expected to come from in-store screens.
The IAB published a framework for maturing in-store media measurement in December 2025. The operator architecture turns floor inputs — display, screen, sample, end-cap, and cart — into a closed-loop instrumented floor that produces measurable outputs: exposure, basket, loyalty, incremental units, sell-through, and proof for the joint business plan. The evidence gap is real: 62 percent of ad buyers cite lack of standardization as a top growth barrier, 41 percent say retail media networks lag other channels on measurement, and Walmart has referenced a 2,300-store base in its electronic shelf-label rollout toward full US footprint. The retailer that can prove the floor first owns inventory nobody else can yet sell.

Capital allocation on the retail floor is shifting from trade promotion to retail media. US trade promotion spend runs $200B+ per year (industry estimate), a large share of it inefficient, unmeasured, and wasted — about 60 to 72 percent of trade promotions fail to break even (Nielsen; McKinsey). The US retail media market in 2026 is forecast at $69.33B, of which a 3.3 percent share implies roughly $2.3B of in-store media today. Why it matters: trade promotion is commonly 15 to 25 percent of gross sales and the second-largest line on the CPG P&L after cost of goods; BCG estimates 60 to 70 percent of 2026 retail media revenue is net-new over historical trade dollars; and reclassifying money already flowing to the floor is the profit-engine thesis. For the retailer, that is new profit at 70 to 90 percent margins. For the brand, it is the first time the in-store dollar comes with a receipt.

The sequence matters. The operator build order is five steps, run in order:
What this means depends on where you sit. A retailer SVP or merchant should build and own the highest-margin aisle in the building. A brand or vendor should demand closed-loop proof and reallocate spend from promotions that lose money to media that compounds. And the execution partner is whoever can prove the floor when the budgets move.
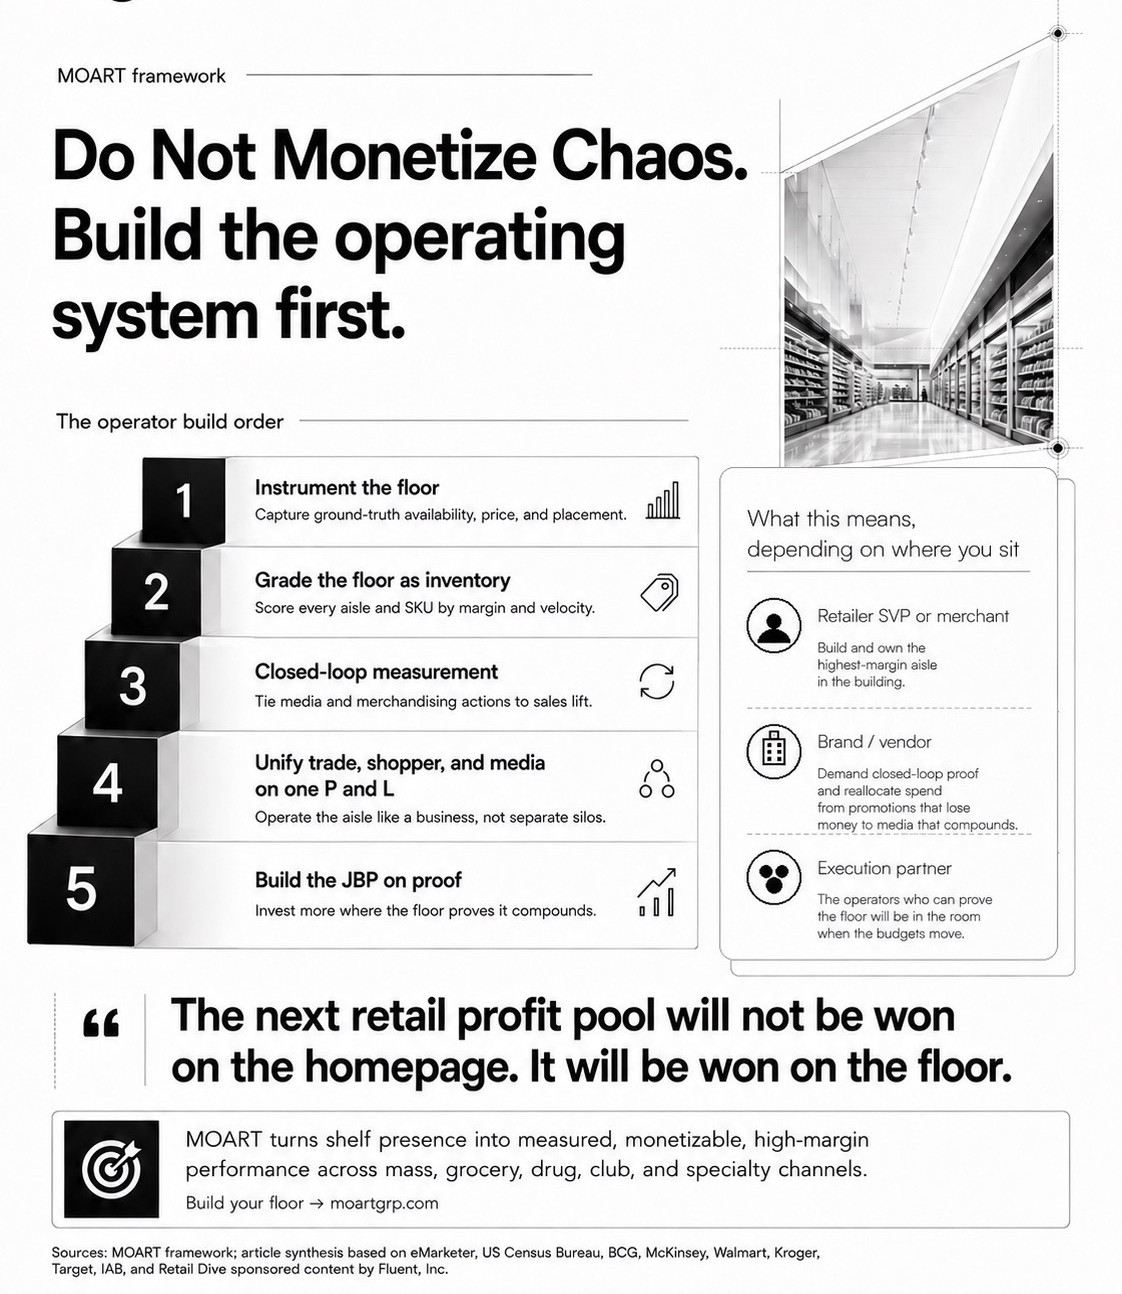
The next retail profit pool will not be won on the homepage. It will be won on the floor.
MOART turns shelf presence into measured, monetizable, high-margin performance across mass, grocery, drug, club, and specialty channels. To build your floor, reach the MOART Retail Operations Desk at moartgrp.com/contact or info@moartgrp.com.
Sources: eMarketer; US Census Bureau; BCG; McKinsey; Walmart, Kroger, and Target investor disclosures; IAB; Nielsen; TELUS Agriculture and Consumer Goods; Retail Dive sponsored content by Fluent, Inc.; MOART analysis.